We use cookies for analytics and advertising. Ads are disabled until you accept advertising cookies. Read our Cookie Policy and Privacy Policy.
Green Coding: How to Build Websites That Use Less Energy | TVerge Tech
Green Coding: How to Build Websites That Use Less Energy
A mechanism-level look at where a website's electricity actually goes — page weight, JavaScript execution, and server load — and the specific changes that cut it
Green Coding: How to Build Websites That Use Less Energy
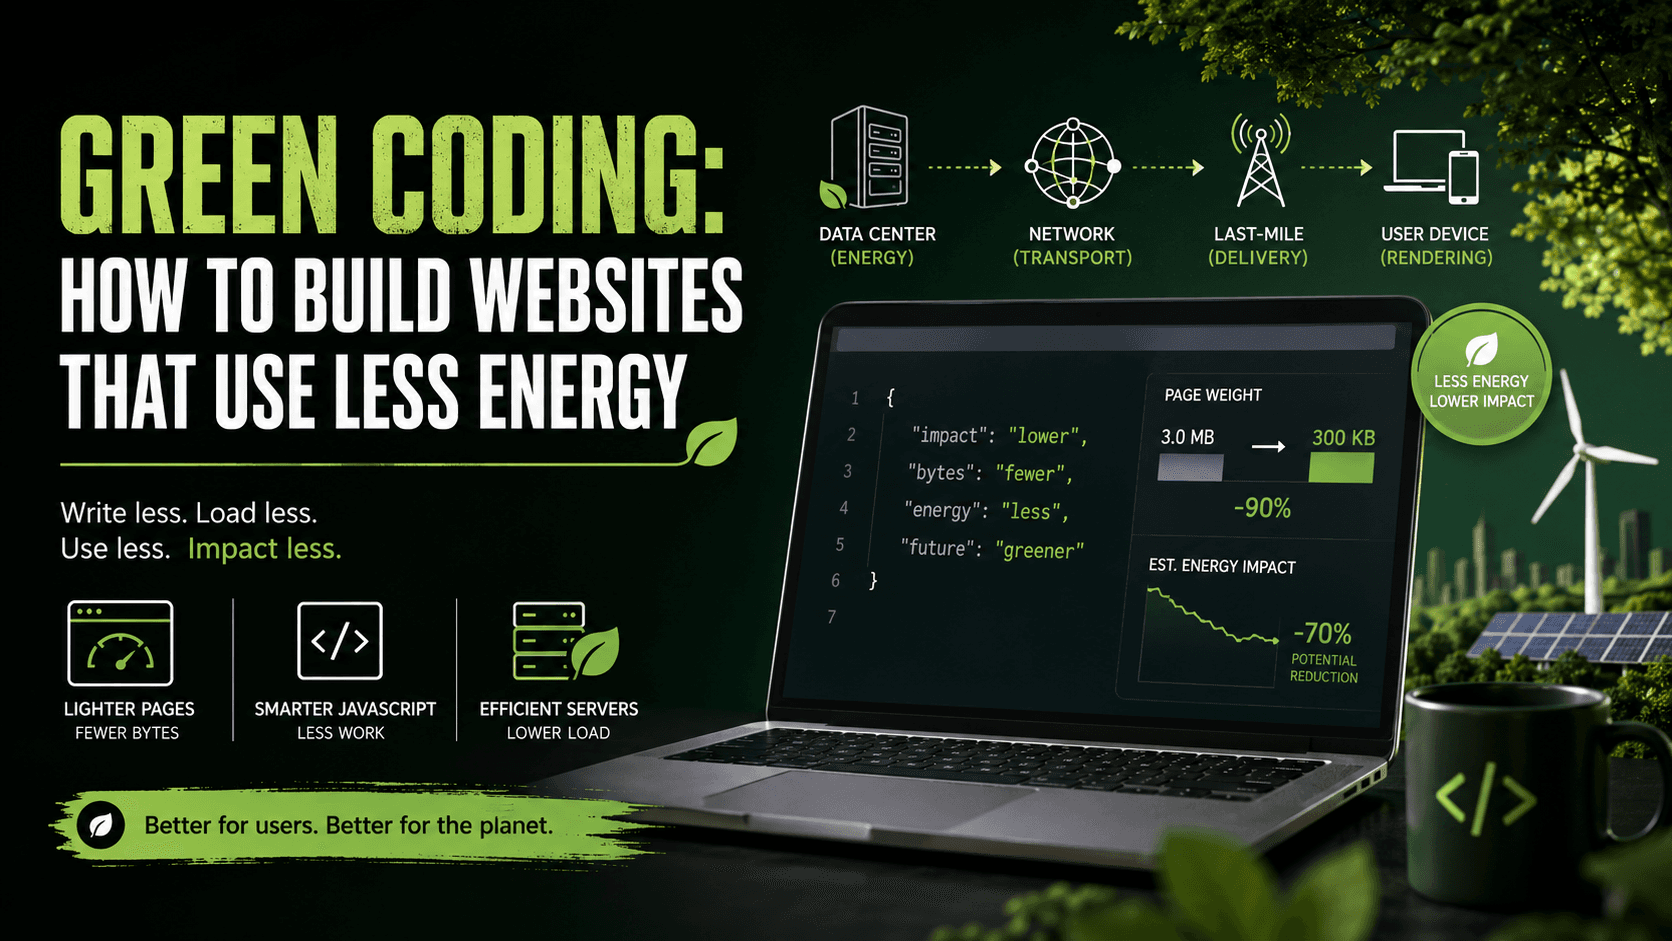
A 3MB landing page and a 300KB landing page don't just load at different speeds — they move a different number of electrons through a different number of routers, base stations, and data center racks to reach the same screen. Most performance work already targets the byte counts that drive energy use, but it's rarely framed that way, which means the actual mechanism — how a fetch() call becomes grid electricity — gets skipped over. Understanding that mechanism changes which optimizations are worth prioritizing, because not every kilobyte costs the same amount of energy, and not every "green" tip actually moves the number that matters.
How a Byte Becomes a Watt
Every model that estimates a website's carbon footprint — including the Sustainable Web Design (SWD) model used by tools like Website Carbon Calculator — starts from the same three-stage pipeline: energy consumed by the data center serving the request, energy consumed by the network transmitting it (undersea cables, core routers, last-mile infrastructure), and energy consumed by the end-user device rendering it, split further into operational and embodied (manufacturing) emissions (Sustainable Web Design Model documentation). Published estimates for the energy intensity of data transfer vary depending on assumptions about network efficiency gains and grid intensity, and the model itself was substantially revised in its v4 release to reflect updated internet energy datasets () — a reminder that these figures are evolving estimates, not fixed physical constants. What holds regardless of which version of the model is used: transfer volume is the lever with the most direct, measurable relationship to energy draw, which is why page weight is where this piece starts.
The complication is that not all bytes are equal in a second way — how they're processed, not just transferred. A 200KB image and a 200KB JavaScript bundle cost roughly the same to transmit, but the JavaScript then has to be parsed, compiled, and executed on the client's CPU, which draws power for seconds or minutes after the transfer finishes. This is why a green-coding strategy has to treat payload reduction and execution-cost reduction as two separate problems, not one.
Where the Bytes Actually Go
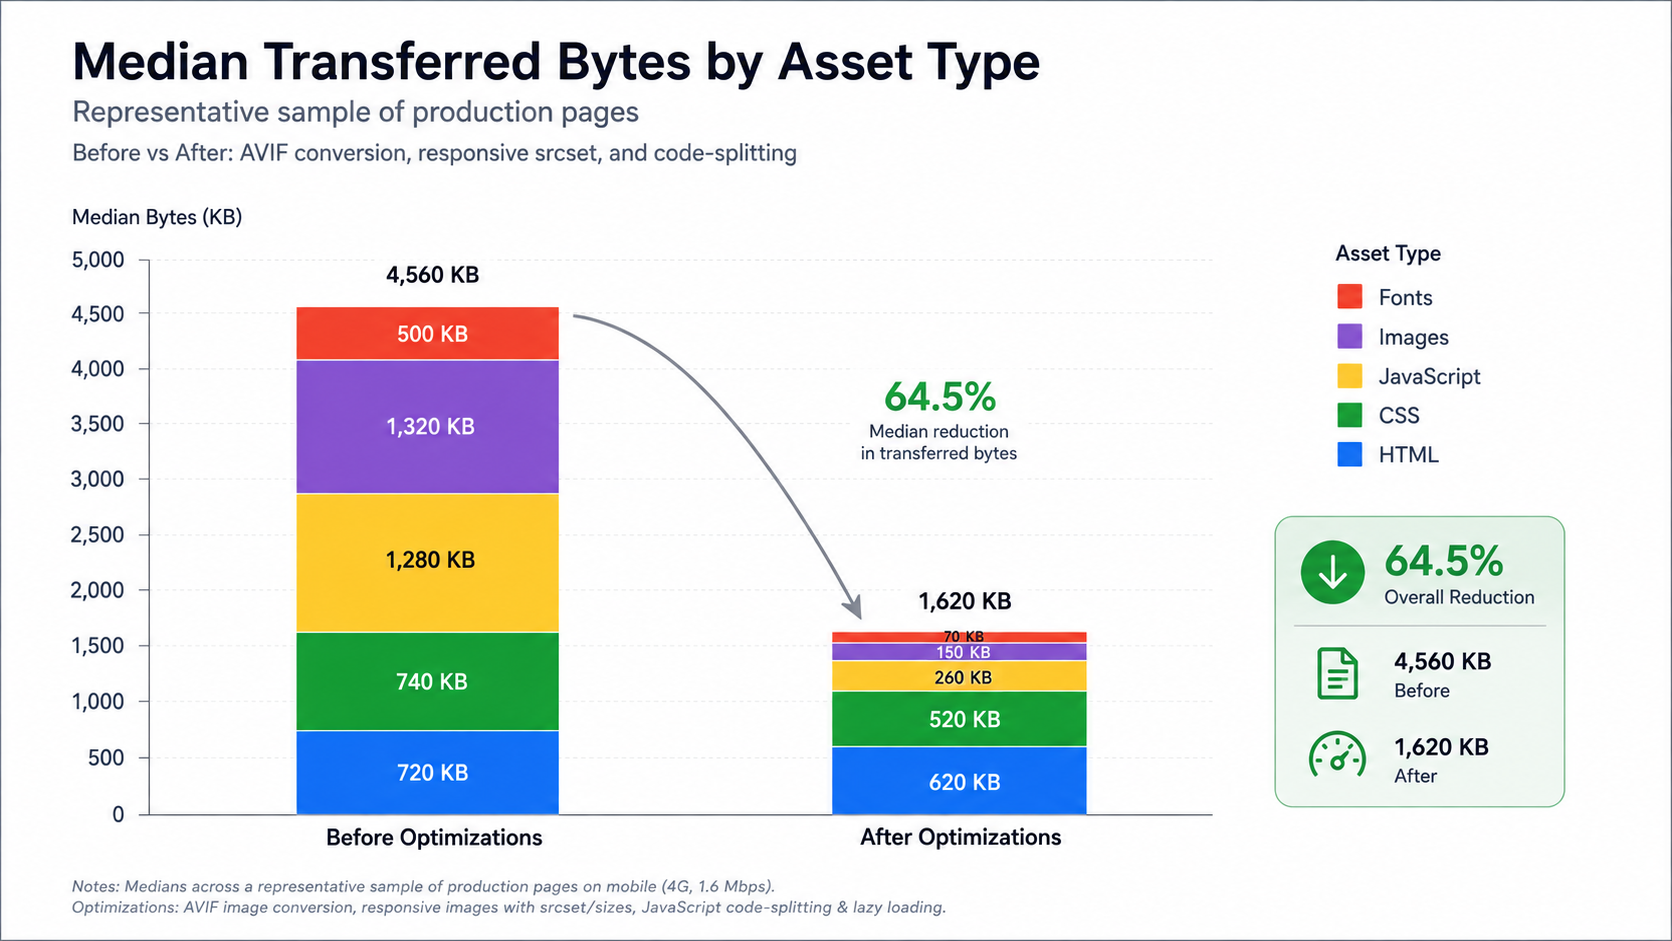
Image and video assets are consistently the largest share of transferred bytes on a typical page, frequently accounting for roughly half of total page weight in aggregate web-performance datasets, with JavaScript and fonts making up most of the rest. That distribution means the highest-leverage changes are almost always in media handling, not in trimming HTML markup.
Compression Format Actually Matters
Switching an image's encoding format changes its file size without changing its resolution, and the differences are large enough to be the single highest-leverage change on a media-heavy page.
Format
Typical size vs. JPEG (same visual quality)
Browser support
Encode cost
JPEG
Baseline
Universal
Low
WebP
~25–35% smaller
Broad (all modern browsers)
Low–moderate
AVIF
~40–50% smaller
Broad in current Chromium/Firefox/Safari releases
Higher (slower to encode)
AVIF's higher encode cost is a one-time build-pipeline expense, while the transfer savings are paid on every single page view — a trade worth making for any image served at meaningful traffic volume. TVerge's own Image Format Converter handles PNG-to-WebP and PNG-to-AVIF conversion directly in the browser, and the Image Compressor tool exposes a live quality slider so you can find the point where file size drops sharply without a visible quality loss — usually somewhere between 60–80% quality for photographic content.
Serving the Right Resolution, Not Just a Smaller File
Compression alone doesn't fix the more common mistake: serving a 2400px-wide hero image to a 375px-wide phone screen. The srcset and sizes attributes (or a framework's built-in equivalent, like next/image) let the browser request only the resolution it actually needs, which on mobile traffic — often over half of total visits for a consumer-facing site — can cut image transfer weight by more than half without touching compression settings at all. TVerge's walkthrough on eliminating layout shift with next/image and next/font covers the same API from the layout-stability angle, but the underlying mechanism — automatic responsive srcset generation and lazy loading below the fold — is the same one doing the energy work here. Lazy-loading with loading="lazy" matters independently of resolution: an image never scrolled into view is an image never decoded, so it costs zero client-side energy regardless of its file size.
JavaScript Weight Is a CPU Problem, Not Just a Network Problem
A minified, gzipped JavaScript bundle might transfer in under a second on a decent connection, but transfer time isn't the cost that matters most here. The browser still has to parse, compile, and execute every byte of it, and on a mid-tier mobile CPU, execution time for a large bundle can run several times longer than the download itself — which is why bundle size correlates more tightly with battery drain than with load-time metrics alone. This is also where framework-level architecture decisions become energy decisions: TVerge's breakdown of App Router vs. Pages Router performance benchmarks documents measurable differences in shipped JavaScript and Time to First Byte between the two Next.js routing models, and a smaller client bundle in that comparison translates directly into less CPU time spent on end-user devices, at scale, across every page load.
Three concrete levers reduce this cost independent of framework choice: code-splitting so a route only loads the JavaScript it needs rather than the whole application bundle; tree-shaking unused exports out of the final build via next.config.js or an equivalent bundler configuration; and auditing third-party scripts, since a single analytics or chat-widget tag can add hundreds of kilobytes of parse-and-execute cost that has nothing to do with the page's actual content.
The Server Side: Fewer Cycles, Not Just Fewer Bytes
Everything so far addresses what gets sent to the browser. The other half of the pipeline is what it costs to generate that response in the first place, and that cost is a function of compute cycles, not payload size.
Caching Turns Repeated Computation Into a Lookup
A server-rendered page that recomputes the same database query and template render on every request burns CPU cycles proportional to traffic volume, with no upper bound. Incremental Static Regeneration (ISR) and similar cache-then-revalidate patterns convert that into a fixed cost paid once per revalidation window, regardless of how many requests arrive in between — which is a direct reduction in server-side energy per visitor, not just a latency improvement. TVerge's guide on when ISR is and isn't the right caching strategy frames this as a per-route trade-off between staleness tolerance and server load, and that trade-off is exactly the one that determines whether a route's energy cost scales with traffic or stays flat.
Smaller Containers Mean Less Idle Overhead
Container image size doesn't affect per-request compute directly, but it does affect two things that add up at scale: cold-start time on serverless or autoscaled infrastructure, and the base memory and CPU footprint every running instance carries regardless of load. TVerge's walkthrough on cutting Node.js image size with multi-stage Docker builds documents production images dropping from over 1GB to under 200MB using npm ci --omit=dev and a distroless runtime stage — a change that shortens cold starts (meaning fewer instances need to stay warm just to hide startup latency) and reduces the idle resource baseline multiplied across every replica in an autoscaling fleet.
Request pipeline energy sources
─────────────────────────────────
[Client device]         ← parse/execute JS, decode images, render layout
       ↑  ↓  (network transfer: cables, routers, base stations)
[CDN / edge cache]       ← served from cache = near-zero compute
       ↑  ↓  (cache miss only)
[Origin server]          ← template render, DB query, business logic
       ↑  ↓
[Database]               ← query execution, disk I/O
A cache hit at the CDN layer means the origin server and database never run at all for that request — which is the single largest energy avoidance available in the entire pipeline, larger than any client-side optimization, because it eliminates compute rather than shrinking it.
Hosting Provider Still Sets the Ceiling
None of the above changes what electricity source actually powers the data center. A host running on a grid with a high proportion of renewable or low-carbon generation, or one that has made verifiable power-purchase agreements for renewable capacity, produces meaningfully less carbon per compute-hour than an equally efficient host on a coal-heavy grid — and no amount of client-side optimization changes that multiplier. The Green Web Foundation maintains a searchable Green Web Directory of hosting providers that have submitted evidence of renewable energy contracts or power-purchase agreements, rather than relying on marketing language alone, and its companion Green Web Check tool verifies whether a specific live domain is currently served from one of those providers. Checking a host against that dataset before migration is a five-minute task that can matter more than months of front-end optimization work, simply because it changes the carbon-per-watt multiplier rather than the watt count itself.
Measuring What You're Actually Shipping
Optimization without measurement risks fixing the wrong bottleneck. CO2.js, an open-source library from the Green Web Foundation, implements the SWD model directly (with an option to switch to The Shift Project's simpler OneByte model) and can be run against real transfer-size data from a build pipeline or CDN logs rather than a synthetic test (CO2.js documentation). Lighthouse's existing performance audit — already run by most CI pipelines — surfaces total transferred bytes and unused JavaScript percentage as part of its documented performance scoring methodology, both of which map directly onto the two cost categories described above, transfer and execution, without needing a separate carbon-specific tool at all.
Key Takeaways
Page weight has a direct, well-modeled relationship to energy use across the network and data-center stages of the pipeline, making transfer size the highest-leverage single metric to track.
Image encoding format (AVIF over WebP over JPEG) and correct resolution serving via srcset typically account for the largest single reduction available on a media-heavy page.
JavaScript's energy cost is dominated by client-side parse and execution time, not transfer time — code-splitting, tree-shaking, and third-party script audits address this directly.
A CDN cache hit avoids origin and database compute entirely, making cache strategy (including ISR) the largest available server-side energy reduction.
Smaller container images reduce cold-start frequency and idle resource baseline at the infrastructure level, independent of per-request logic.
Hosting provider grid mix sets a multiplier on every other optimization — verifying a host's renewable energy claims changes the carbon output of unchanged code.
3Demystifying the Rust Borrow Checker: Fix Lifetime Errors Fast