Load Testing and Observability for LLM Streaming Endpoints in Python
A streaming endpoint can pass every test you wrote for it and still fall over on a busy afternoon. The usual reason is that the tests measured the wrong thing. A single request looks fast. The average latency looks fine. Then a few hundred users open long-lived connections at once, memory climbs, the event loop starts to stutter, and the first word of every answer takes ten seconds to appear.
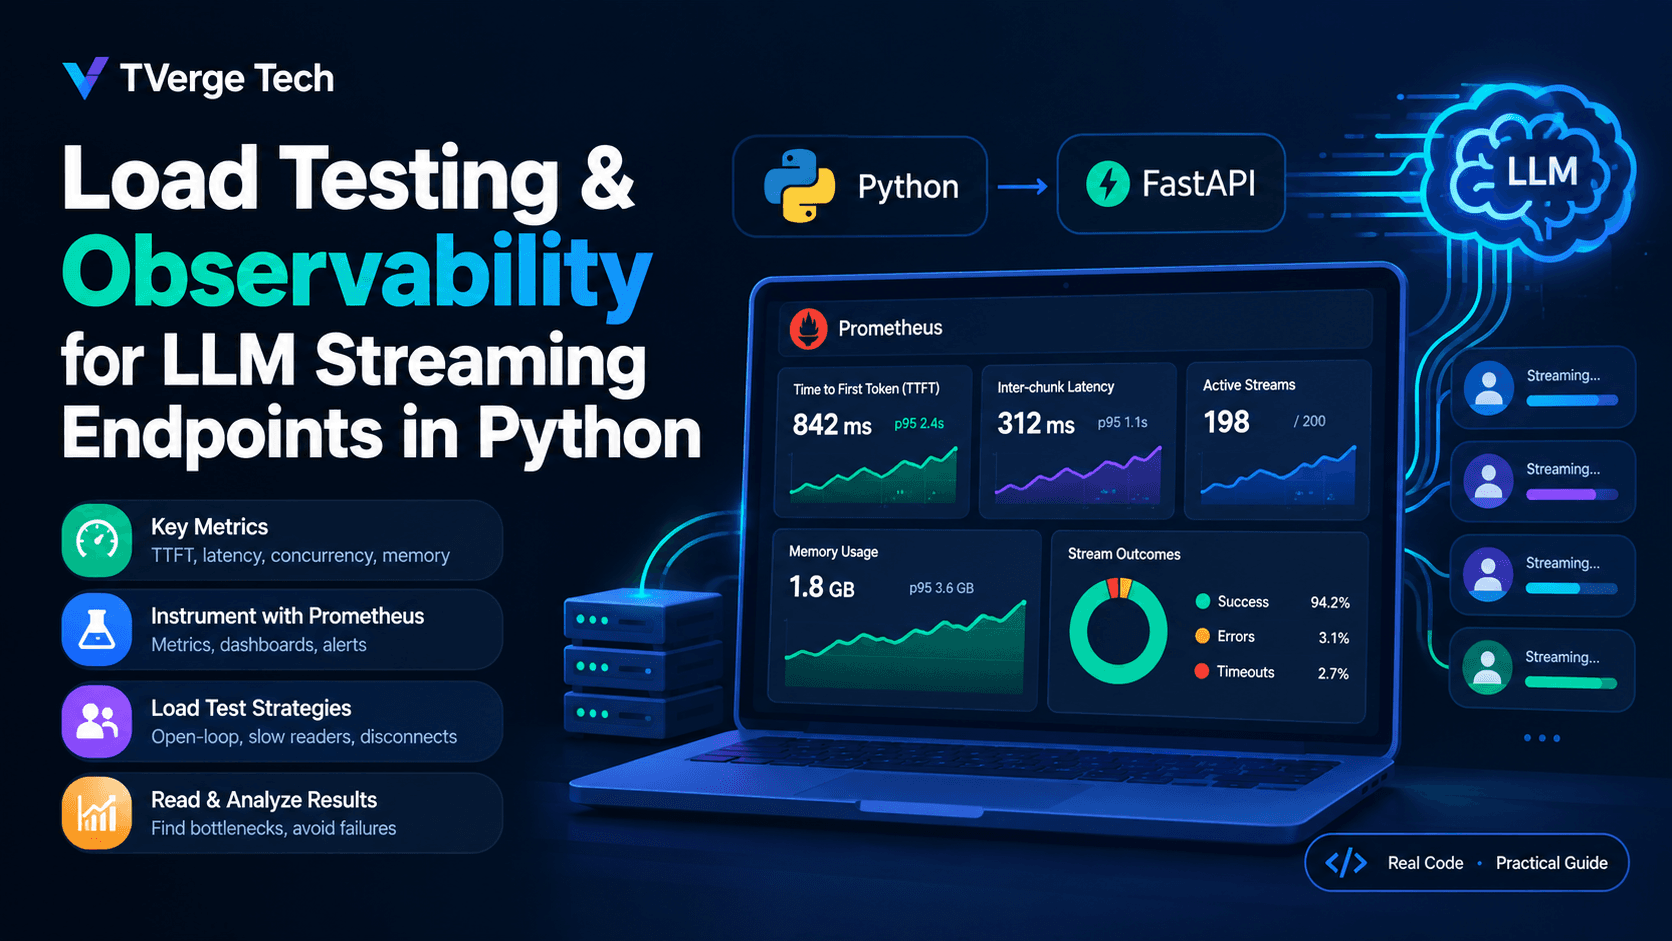
This guide shows how to test and observe a streaming LLM backend in Python: which metrics matter (time to first token, inter-chunk latency, active streams, memory), how to instrument a FastAPI service with Prometheus, how to build a repeatable load test that doesn't burn your API budget, and how to read the results.
Track time to first token (TTFT), the gap between chunks, total stream duration, and stream outcomes. Averages hide the problems, so use percentiles.
Measure upstream wait and downstream write time separately. Together they tell you whether the model, your code, or your users' connections are the bottleneck.
Load test against a fake upstream first. It is cheap, repeatable, and lets you inject failures on demand.
Use an open-loop load generator with a fixed arrival rate, and run slow-reader and disconnect scenarios as well as the happy path.
Memory problems show up as a staircase across repeated load waves, and as an active-streams gauge that never returns to zero.
Why streaming endpoints need a different kind of load test
A classic JSON endpoint holds a connection for milliseconds. A streaming LLM endpoint may hold one for ten seconds, or a few minutes for long generations. That changes what "load" means.
The relationship is captured by Little's Law: the average number of items in a system equals the arrival rate multiplied by the average time each spends there. For streams, that means:
concurrent streams ≈ new streams per second × average stream duration
If you accept 20 new streams per second and each lasts about 10 seconds, you are holding roughly 200 open streams at any moment. Each one occupies a socket, some memory, and a task on the event loop. Your service can be nowhere near its requests-per-second limit and still be at its concurrency limit.
Three other things make streaming different:
The interesting latency is a distribution over time, not one number. A response has a first-token delay, then a series of gaps between chunks, then an end. You need all three.
Slow consumers matter. A client on a poor mobile connection reads slowly, and your server has to decide what to do with the output it can't deliver yet. That's where memory quietly grows.
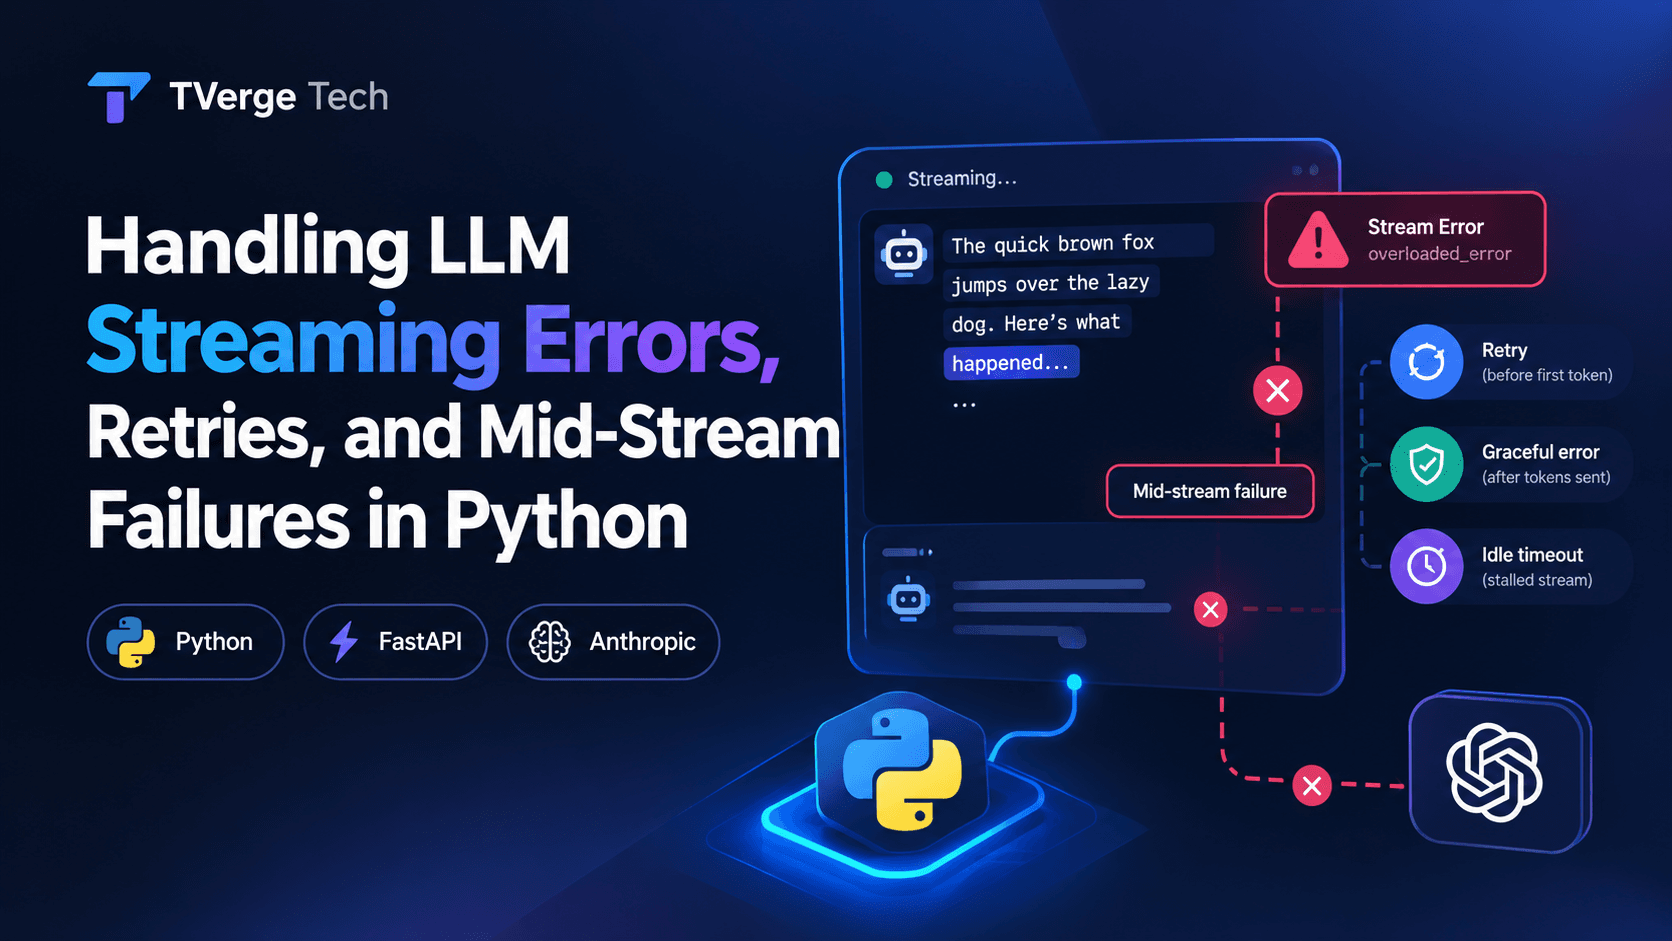
Failures are partial. As the previous article showed, a stream can fail after it starts, and Anthropic's streaming documentation notes that errors can arrive inside the event stream itself. Your load test needs to exercise that path, not just successes.
The metrics that matter
Start with a short list of signals. Each one answers a specific question.
Metric
What it measures
Question it answers
Time to first token (TTFT)
Request start to first chunk received from the model
Does the app feel responsive?
Upstream chunk gap
Wait for each next chunk from the model
Is the model or network slow mid-stream?
Downstream write time
How long each chunk waits to be written to the client
Are slow clients or proxies pushing back?
Stream duration
Start to terminal event
How long do we hold resources?
Active streams (gauge)
Streams open right now
How close are we to capacity?
Stream outcomes (counter)
done, error, rejected, client_disconnect
What share of streams fail or get abandoned?
Upstream retries (counter)
Retries before the first token, by error code
Is the provider degrading?
Event loop lag
How late a timer fires
Is something blocking the loop?
Process memory and file descriptors
RSS and open sockets
Are we leaking?
TTFT and per-token latency are the standard streaming metrics. OpenTelemetry's GenAI semantic conventions define gen_ai.server.time_to_first_token and gen_ai.server.time_per_output_token as histograms measured in seconds. Those conventions are still marked as in development, so check the current names before you standardize on them. The Prometheus names below follow the Prometheus naming conventions, which call for base units such as seconds, and you can map them to OpenTelemetry names if you later move to an OTel metrics pipeline.
One caution on what these numbers mean. A TTFT measured inside your server starts when the request arrives and stops when the first chunk comes back from the provider. It does not include the network hop to the user or any proxy buffering. It's the right number for diagnosing your backend, but the user's experience is slightly longer.
Instrument the service with Prometheus
Prometheus histograms are the right tool for latency, because you can compute percentiles across many instances at query time. The Prometheus documentation on histograms and summaries explains why, and why bucket boundaries should be chosen to bracket the values you care about. Averages are a poor summary of latency, and a histogram lets you ask for the 95th or 99th percentile instead.
Define the metrics
# app/metrics.py
import asyncio
import time

from opentelemetry import trace
from prometheus_client import Counter, Gauge, Histogram

tracer = trace.get_tracer("llm.stream")

STREAMS_ACTIVE = Gauge("llm_streams_active", "Streams currently open")
STREAMS_TOTAL = Counter("llm_streams_total", "Finished streams by outcome", ["outcome"])
UPSTREAM_RETRIES = Counter("llm_upstream_retries_total",
                           "Retries before the first token", ["code"])

TTFT = Histogram(
    "llm_time_to_first_token_seconds", "Request start to first upstream chunk",
    buckets=(0.1, 0.25, 0.5, 1, 2, 4, 8, 15, 30),
)
UPSTREAM_GAP = Histogram(
    "llm_upstream_chunk_gap_seconds", "Wait for the next upstream chunk",
    buckets=(0.005, 0.01, 0.025, 0.05, 0.1, 0.25, 0.5, 1, 2, 5),
)
DOWNSTREAM_WRITE = Histogram(
    "llm_downstream_write_seconds", "Time a chunk waits to be written to the client",
    buckets=(0.0005, 0.001, 0.005, 0.01, 0.05, 0.1, 0.5, 1, 5),
)
DURATION = Histogram(
    "llm_stream_duration_seconds", "Total stream duration", ["outcome"],
    buckets=(0.5, 1, 2, 5, 10, 20, 40, 80, 160),
)
LOOP_LAG = Histogram(
    "asyncio_loop_lag_seconds", "How late a 100 ms timer fires",
    buckets=(0.001, 0.005, 0.01, 0.025, 0.05, 0.1, 0.25, 0.5, 1),
)


class StreamMeter:
    """Tracks one stream from request arrival to its terminal outcome."""

    def __init__(self, request_id: str):
        self.started = time.perf_counter()
        self.chunks = 0
        self._finished = False
        STREAMS_ACTIVE.inc()
        self.span = tracer.start_span("llm.stream")
        self.span.set_attribute("llm.request_id", request_id)

    def first_chunk(self) -> None:
        TTFT.observe(time.perf_counter() - self.started)
        self.span.add_event("first_token")

    def finish(self, outcome: str) -> None:
        if self._finished:              # guarantee exactly-once accounting
            return
        self._finished = True
        STREAMS_ACTIVE.dec()
        STREAMS_TOTAL.labels(outcome).inc()
        DURATION.labels(outcome).observe(time.perf_counter() - self.started)
        self.span.set_attribute("llm.outcome", outcome)
        self.span.set_attribute("llm.chunks", self.chunks)
        self.span.end()


async def monitor_loop_lag(interval: float = 0.1) -> None:
    loop = asyncio.get_running_loop()
    expected = loop.time() + interval
    while True:
        await asyncio.sleep(interval)
        now = loop.time()
        LOOP_LAG.observe(max(0.0, now - expected))
        expected = now + interval
Some design notes:
Label only bounded values. The outcome label has four possible values. Never label a metric with a request ID, user ID, or prompt text. The Prometheus instrumentation guidance warns that every unique label combination creates a new time series, and unbounded labels can overwhelm your monitoring system.
The meter guarantees exactly-once accounting.finish() runs from a finally block, so a stream that ends by completing, failing, or being cancelled still decrements the gauge once. That is what makes the active-streams gauge trustworthy as a leak detector.
Timing uses a monotonic clock.time.perf_counter() is a monotonic, high-resolution clock, so system clock adjustments can't distort your durations.
The span uses start_span, not start_as_current_span. A streaming response runs across many event-loop turns, and tying a span to the "current" context across yields is error-prone. Creating the span explicitly and ending it in finish() avoids that. Without an OpenTelemetry SDK configured, the API calls are no-ops, so the code is safe to ship before tracing is set up. See the OpenTelemetry Python instrumentation guide for manual spans and the Python documentation for exporter setup.
Event loop lag is a canary. If a synchronous call, a large JSON serialization, or heavy logging blocks the loop, this timer fires late. Rising lag means every stream on that worker is being delayed, no matter how healthy the provider is. Python's asyncio debug mode documentation covers related tools for finding slow callbacks.
Wire the meter into the endpoint
Replace the endpoint and events() function from the previous article with this version. The main change is that events() now times two things separately: how long it waits on the model, and how long each chunk waits to be written to the client. The loop-lag monitor starts and stops with FastAPI's lifespan events, so it runs for the life of the worker and is cancelled cleanly on shutdown.
# app/main.py (changed parts)
import asyncio
import contextlib
import time
import uuid

from fastapi import FastAPI, HTTPException
from fastapi.responses import StreamingResponse
from prometheus_client import make_asgi_app

from app.metrics import (DOWNSTREAM_WRITE, UPSTREAM_GAP, StreamMeter,
                         monitor_loop_lag)
from app.streaming import StreamFailure, open_upstream, resilient_stream


@contextlib.asynccontextmanager
async def lifespan(app: FastAPI):
    lag_task = asyncio.create_task(monitor_loop_lag())
    yield
    lag_task.cancel()
    with contextlib.suppress(asyncio.CancelledError):
        await lag_task


app = FastAPI(lifespan=lifespan)
app.mount("/metrics", make_asgi_app())   # keep this off the public internet


async def events(upstream, first, request_id: str, meter: StreamMeter):
    outcome = "client_disconnect"        # remains this value if we are cancelled
    sent = 0
    try:
        chunk = first
        while chunk is not None:
            sent += 1
            t = time.perf_counter()
            yield sse("token", {"text": chunk}, f"{request_id}:{sent}")
            # Time spent suspended at `yield` is time the server needed to hand
            # the chunk to the client connection.
            DOWNSTREAM_WRITE.observe(time.perf_counter() - t)

            t = time.perf_counter()
            try:
                chunk = await anext(upstream)
            except StopAsyncIteration:
                chunk = None
            else:
                UPSTREAM_GAP.observe(time.perf_counter() - t)
        outcome = "done"
        yield sse("done", {"request_id": request_id, "chunks": sent})
    except StreamFailure as failure:
        outcome = "error"
        log.warning("stream_failed", extra={"request_id": request_id,
                                            "code": failure.code, "chunks": sent})
        yield sse("error", {"code": failure.code, "request_id": request_id,
                            "partial": failure.partial})
    except Exception:
        outcome = "error"
        log.exception("stream_crashed", extra={"request_id": request_id})
        yield sse("error", {"code": "internal_error", "request_id": request_id,
                            "partial": sent > 0})
    finally:
        meter.chunks = sent
        meter.finish(outcome)
        await upstream.aclose()


@app.post("/v1/chat/stream")
async def chat_stream(body: ChatRequest):
    request_id = uuid.uuid4().hex
    meter = StreamMeter(request_id)
    upstream = resilient_stream(lambda: open_upstream(body.prompt))
    try:
        first = await anext(upstream)
    except StopAsyncIteration:
        first = None
    except StreamFailure as failure:
        meter.finish("rejected")
        raise HTTPException(
            status_code=HTTP_STATUS.get(failure.code, 502),
            detail={"code": failure.code, "request_id": request_id},
        )
    except BaseException:                # client left while waiting for token one
        meter.finish("client_disconnect")
        raise
    if first is not None:
        meter.first_chunk()
    return StreamingResponse(
        events(upstream, first, request_id, meter),
        media_type="text/event-stream",
        headers={"Cache-Control": "no-cache", "X-Accel-Buffering": "no"},
    )
StreamingResponse comes from Starlette, which FastAPI re-exports. See the Starlette responses documentation for how the response iterates your generator.
Also count retries, so a degrading provider shows up before users complain. Add one line to resilient_stream from the previous article, just before the backoff sleep:
How to read the write-time histogram: the operating system and the ASGI server buffer some output, so a single slow client won't show up on the first few chunks. Once those buffers fill, send starts to wait, and llm_downstream_write_seconds climbs. That's the early sign of backpressure, and it's exactly the situation the first article's buffering advice was meant to handle.
If you run several worker processes, the default Prometheus client keeps separate metrics per process. The prometheus_client documentation describes multiprocess mode for that case, including its limits for some gauge and collector types, so check it before you scale out.
Queries worth saving
# p95 time to first token over 5 minutes
histogram_quantile(0.95, sum by (le) (rate(llm_time_to_first_token_seconds_bucket[5m])))

# share of streams that ended in an error
sum(rate(llm_streams_total{outcome="error"}[5m])) / sum(rate(llm_streams_total[5m]))

# p99 event loop lag
histogram_quantile(0.99, sum by (le) (rate(asyncio_loop_lag_seconds_bucket[5m])))
See the Prometheus documentation for histogram_quantile for how the estimate depends on your bucket layout. On Linux, the default client registry also exports process metrics such as process_resident_memory_bytes and process_open_fds, which you'll use in the memory section below.
Build a fake upstream for repeatable tests
Load testing against a real LLM provider is a poor default. It costs money, it collides with rate limits, and the provider's own latency varies from run to run, so you can't tell whether a regression came from your code or from theirs. Anthropic's rate limits documentation explains that exceeding a limit returns a 429 with a retry-after header, and that short bursts can trip limits even when your average rate is fine. OpenAI publishes similar guidance in its rate limits guide. A load test that mostly measures 429s isn't measuring your service.
Instead, add a fake backend that behaves like a model: a startup delay, a steady token rate, and optional failures. It lives next to the real one and is selected with an environment variable.
# app/streaming.py (additions)
import os
import random


async def fake_tokens(prompt: str) -> AsyncIterator[str]:
    first_delay = float(os.getenv("FAKE_FIRST_TOKEN_S", "0.6"))
    interval = float(os.getenv("FAKE_INTERVAL_S", "0.03"))
    count = int(os.getenv("FAKE_TOKENS", "300"))
    fail_rate = float(os.getenv("FAKE_FAIL_RATE", "0"))

    fail_at = random.randrange(count) if random.random() < fail_rate else None
    await asyncio.sleep(first_delay * random.uniform(0.7, 1.5))   # simulated prefill
    for i in range(count):
        if i == fail_at:
            raise TimeoutError("injected failure")   # retryable before token one,
        yield f"tok{i} "                              # a partial failure after it
        await asyncio.sleep(interval * random.uniform(0.5, 1.5))


def open_upstream(prompt: str) -> AsyncIterator[str]:
    if os.getenv("LLM_BACKEND") == "fake":
        return fake_tokens(prompt)
    return anthropic_tokens(prompt)
The failure injection reuses the exact code path from the previous article. A failure at token zero exercises the silent-retry route. A failure later exercises the partial: true error route. Set FAKE_FAIL_RATE=0.05 and you can watch both appear in your outcome counters.
The fake tests your code, not the provider. That is the point, but it means you should still run one short, low-rate test against the real provider before a major release, to confirm that real-world chunk sizes, pauses, and errors behave the way your fake assumes.
Write a streaming-aware load generator
Generic HTTP load tools often report the wrong number for streaming. Locust's built-in timing for a streamed request, for instance, stops when the response headers arrive, as its documentation and source show. You can still use Locust for user modeling by firing custom events for TTFT and total duration, and Grafana's k6 has arrival-rate executors worth knowing about. But a small custom script gives you full control over what "first token" means, so it is a good place to start.
Two design choices matter more than the tool:
Open loop, not closed loop. A closed-loop generator sends the next request only after the previous one finishes. When your server slows down, the generator automatically slows down too and stops sampling the bad period, which makes results look better than reality. An open-loop generator starts new streams at a fixed rate regardless of how fast earlier ones finish, which is how real users behave. In the script below, each stream runs as its own asyncio task, so a slow stream never delays the next arrival.
Measure from the client. The script parses the event: and data: lines of the server-sent events format and timestamps each token event, so TTFT includes the network, the proxy, and your priming logic.
# loadtest.py
import argparse
import asyncio
import random
import statistics
import time
from collections import Counter

import httpx


def pct(values: list[float], p: int) -> float:
    if len(values) < 2:
        return float("nan")
    return statistics.quantiles(values, n=100)[p - 1]


async def one_stream(client: httpx.AsyncClient, url: str, args) -> dict:
    t0 = time.perf_counter()
    last = t0
    ttft, gaps, chunks = None, [], 0
    event, outcome = None, "ok"
    abort_at = random.randint(5, 50) if random.random() < args.abort_rate else None
    try:
        async with client.stream("POST", url,
                                 json={"prompt": "Explain backpressure."}) as resp:
            if resp.status_code != 200:
                return {"outcome": f"http_{resp.status_code}", "ttft": None,
                        "gaps": [], "total": time.perf_counter() - t0}
            async for line in resp.aiter_lines():
                if line.startswith("event:"):
                    event = line[6:].strip()
                    if event == "error":
                        outcome = "stream_error"
                elif line.startswith("data:") and event == "token":
                    now = time.perf_counter()
                    if ttft is None:
                        ttft = now - t0
                    else:
                        gaps.append(now - last)
                    last = now
                    chunks += 1
                    if abort_at and chunks >= abort_at:
                        outcome = "client_abort"        # simulate a user closing the tab
                        break
                    if args.read_delay_ms:
                        await asyncio.sleep(args.read_delay_ms / 1000)   # slow reader
        if outcome == "ok" and event != "done":
            outcome = "truncated"                       # no terminal event arrived
    except httpx.HTTPError as exc:
        outcome = f"client_{type(exc).__name__}"
    return {"outcome": outcome, "ttft": ttft, "gaps": gaps,
            "total": time.perf_counter() - t0}


def report(results: list[dict]) -> None:
    outcomes = Counter(r["outcome"] for r in results)
    series = {
        "ttft": [r["ttft"] for r in results if r["ttft"] is not None],
        "chunk gap": [g for r in results for g in r["gaps"]],
        "total": [r["total"] for r in results],
    }
    print(f"streams: {len(results)}  outcomes: {dict(outcomes)}")
    for name, data in series.items():
        print(f"{name:10s} p50={pct(data, 50):.3f}s  "
              f"p95={pct(data, 95):.3f}s  p99={pct(data, 99):.3f}s")


async def main(args) -> None:
    url = args.base_url.rstrip("/") + "/v1/chat/stream"
    limits = httpx.Limits(max_connections=None, max_keepalive_connections=None)
    timeout = httpx.Timeout(120.0, connect=10.0)
    tasks, start, n = [], time.perf_counter(), 0
    async with httpx.AsyncClient(limits=limits, timeout=timeout) as client:
        while time.perf_counter() - start < args.duration:
            tasks.append(asyncio.create_task(one_stream(client, url, args)))
            n += 1
            # schedule against the clock so slow iterations don't reduce the rate
            await asyncio.sleep(max(0.0, start + n / args.rate - time.perf_counter()))
        results = await asyncio.gather(*tasks)
    report(results)


if __name__ == "__main__":
    ap = argparse.ArgumentParser()
    ap.add_argument("--base-url", default="http://localhost:8000")
    ap.add_argument("--rate", type=float, default=10, help="new streams per second")
    ap.add_argument("--duration", type=float, default=60, help="seconds of arrivals")
    ap.add_argument("--abort-rate", type=float, default=0.0,
                    help="fraction of streams the client abandons midway")
    ap.add_argument("--read-delay-ms", type=float, default=0.0,
                    help="artificial delay per chunk to simulate slow readers")
    asyncio.run(main(ap.parse_args()))
Give the generator its own machine, or at least its own cores. A Python load generator can saturate a CPU core. If the generator is the bottleneck, your TTFT numbers will be inflated by your test tool instead of your service.
Discard the warm-up. The first 20 to 30 seconds include connection setup and cold caches. Either exclude them or run long enough that they don't dominate.
Collect enough samples. A 99th percentile from 50 streams is mostly noise. Aim for hundreds of streams before trusting p99.
In slow-reader runs, ignore the client-side chunk gaps. The artificial delay is included in them. In that run, the number to watch is your server's memory.
Scenarios worth running
One steady-state test tells you very little. Run a small set of scenarios that each target a different failure mode.
Scenario
How
What to watch
Baseline
1 to 2 streams per second for a couple of minutes
Reference TTFT and chunk gaps with no contention
Ramp
Increase --rate in steps until something breaks
The rate where TTFT p95 or error rate bends upward
Soak
A moderate rate for 30 to 60 minutes
Memory trend, open file descriptors, slow drift in latency
Spike
Jump from a low rate to a high one, then back
Recovery time, queueing, whether active_streams returns to baseline
Slow readers
--read-delay-ms 50 (or more) on a share of traffic
Downstream write time, memory growth, worker stability
Real 429 behavior and the shape of retry-after handling
Run the ramp first. It gives you a capacity number that shapes everything else. For example, if TTFT p95 stays flat until roughly 40 new streams per second and then climbs quickly, your practical limit is somewhere just below that, and Little's Law tells you how many concurrent streams that implies.
If you want unique correlation IDs for each simulated user, or a batch of IDs to seed test data, the Bulk UUID/GUID Generator can produce them in bulk. And when a load tool exports results as JSON, pasting them into the JSON Formatter & Validator makes them much easier to scan.
Memory: what to measure and what to look for
Memory problems in streaming services rarely look like a single dramatic leak. They look like slow growth that follows traffic patterns. The usual suspects are:
Unbounded buffers. A queue between the model reader and the client writer, with no size limit, turns a slow client into a growing pile of chunks.
Streams that never get closed. A missing finally or an unclosed upstream connection keeps buffers, sockets, and tasks alive after the user is gone.
Accumulating text. Building the full response string for every stream "for logging" multiplies memory by concurrent streams.
Per-stream state kept forever. Dictionaries keyed by request ID that never get cleaned up.
Read the right signals
RSS across waves. Resident memory by itself is hard to interpret, because Python's allocator may not give freed memory back to the operating system. A better test is to run several identical load waves with a pause between each, and compare the memory level after each pause. If it returns to roughly the same baseline, you're fine. If it steps upward each time, something is being retained.
The active-streams gauge. After load stops, llm_streams_active must return to zero. If it doesn't, some code path isn't reaching finally, which is precisely the bug the meter is designed to expose.
File descriptors. Each stream uses a socket. A growing process_open_fds after load ends means connections aren't being closed. Also check your OS limit (ulimit -n), because running out of descriptors produces confusing connection errors under load.
Find the allocation with tracemalloc
When the trend points to a leak, use Python's built-in tracemalloc to see where the memory was allocated. Enable it only in a test environment, because it slows the process down noticeably, so don't take latency measurements while it is on.
# app/main.py (test environments only)
import os

if os.getenv("ENABLE_MEM_DEBUG") == "1":
    import tracemalloc
    tracemalloc.start(10)
    _snap: dict = {}

    @app.post("/debug/mem/mark")
    async def mem_mark():
        _snap["base"] = tracemalloc.take_snapshot()
        return {"ok": True}

    @app.get("/debug/mem/diff")
    async def mem_diff():
        stats = tracemalloc.take_snapshot().compare_to(_snap["base"], "lineno")
        return [str(s) for s in stats[:10]]
The workflow is: call /debug/mem/mark, run a load wave, wait for streams to drain, then call /debug/mem/diff. The top entries show which lines of code allocated memory that is still alive. Never ship these endpoints to production, since they expose internals and add overhead.
Reading the results
Once you have both server metrics and client numbers, most problems fall into recognizable patterns.
What you see
Likely cause
What to check or try
TTFT rises with load, chunk gaps stay flat
Queueing before the first token: provider limits, retries, or a concurrency cap
Retry counter, rate_limited errors, upstream client connection pool limits
Chunk gap p99 and event loop lag rise together
The event loop is blocked by CPU or synchronous work
Move heavy work off the loop with asyncio.to_thread, cut per-chunk work, batch tokens (see the first article)
Downstream write time rises and memory grows
Slow clients or a buffering proxy
Bounded buffers, drop or disconnect policy for stalled clients, proxy buffering settings
active_streams doesn't return to zero
Unclosed streams or a missing finally
Audit cleanup paths; run the disconnect-storm scenario
RSS climbs in steps across load waves
Retained per-stream state
tracemalloc diff; look for growing dictionaries, queues, and logged text
Errors at a fixed stream count
A limit: file descriptors, pool size, or server concurrency cap
ulimit -n, SDK connection pool settings, ASGI server limits
Streams die at a round number of seconds
A proxy or load balancer idle or total timeout
Heartbeat comments (see the previous article) and proxy timeout settings
Latency fine on one worker, worse on several
Shared bottleneck upstream, or metrics not aggregated correctly
Multiprocess metrics setup; provider rate limits
Tuning knobs that come up in practice
Server limits. Uvicorn exposes options such as --limit-concurrency, which returns HTTP 503 once a set number of connections is reached, and --timeout-graceful-shutdown. See the Uvicorn settings reference and its deployment guide. A deliberate 503 under overload is usually better than a slow collapse for everyone.
Graceful deploys. A rolling deploy interrupts every open stream on the instance being replaced. Give streams time to finish by draining, and make sure clients treat a dropped connection as the retryable case the previous article describes.
Upstream connection pools. Check the connection limits on your SDK's HTTP client. If the pool is smaller than your peak stream count, streams queue for a connection and your TTFT grows for reasons unrelated to the model.
Per-chunk work. Serializing JSON, writing a log line, or updating a metric on every token is affordable at low concurrency and expensive at high concurrency. The first article's token-batching advice pays off most here.
Worker count. More worker processes add CPU headroom but multiply per-process memory and change how you aggregate metrics. Change one thing at a time and re-run the ramp.
Turn the numbers into service-level objectives
Once you have a baseline, define what "healthy" means and alert on it. Pick thresholds from your own data and your product's needs, since no universal numbers apply. A conversational assistant may need a much tighter TTFT than a document summarizer that streams for a minute.
A workable starting set looks like this:
A p95 TTFT target, measured over a rolling window.
A ceiling on the share of streams ending in error, excluding client_disconnect.
A p99 event loop lag limit, as an early warning before latency shows up.
An alert on llm_streams_active staying high while request arrivals fall.
A memory alert based on the post-load baseline, not on raw RSS.
Alert on symptoms users can feel (slow first token, failed streams) and use the internal signals (loop lag, write time, retries) to diagnose. Review the thresholds after each load test, because the test is what tells you where they should be.
Production checklist
TTFT, chunk gap, write time, and stream duration are recorded as histograms.
Active streams and outcomes are tracked, and the gauge returns to zero after load.
Metric labels are bounded; request IDs never appear as labels.
Event loop lag is monitored.
A fake upstream with failure injection exists for repeatable tests.
The load generator is open-loop, runs on separate capacity, and measures from the client.
Ramp, soak, spike, slow-reader, disconnect, and failure scenarios have all been run.
Memory is checked across repeated waves, not just at one point in time.
File descriptor and connection pool limits are known and set deliberately.
One low-rate test against the real provider confirms the fake's assumptions.
SLOs and alerts are based on measured baselines.
/metrics and any debug endpoints are not exposed publicly.
Frequently asked questions
What is a good TTFT for an LLM streaming endpoint?
It depends on the model, the prompt length, and the product. Measure your own baseline first, then set a target that fits your users' expectations. Compare TTFT at low load with TTFT at your expected peak, because the gap between them tells you how much your infrastructure adds.
Should I load test against the real LLM API?
Not for large-scale tests. It's expensive, it runs into provider rate limits, and it makes results hard to reproduce. Use a fake upstream for capacity and regression testing, and run a short, low-rate test against the real provider to validate your assumptions. Check your provider's terms and rate limits before any sustained test.
Why measure inter-chunk latency and not just total time?
Total time hides stalls. Two streams can take the same 10 seconds while one delivers smoothly and the other freezes for four seconds in the middle. Users notice the freeze, and only the gap distribution reveals it.
Why use an open-loop load test?
A closed-loop test slows itself down when your server slows down, which understates the problem. An open-loop test keeps sending streams at a fixed rate, so queues build the way they would with real users.
How do I know if I have a memory leak or just normal allocator behavior?
Run repeated identical load waves with idle pauses. If memory returns to a similar baseline after each pause, it is normal allocator behavior. If it climbs step by step, or the active-streams gauge never returns to zero, something is being retained, and tracemalloc snapshots can point to the code.
Can I use Locust or k6 instead of a custom script?
Yes, for user modeling and scheduling. Just remember that default timings for streamed responses may stop when headers arrive, so record TTFT and total duration yourself as custom metrics. See the Locust and k6 documentation for details.
Conclusion
Streaming endpoints fail in ways that request-per-second benchmarks can't see. To find those failures, measure the parts of a stream separately: the wait for the first token, the pace between chunks, the time to hand data to the client, and the outcome at the end. Then generate load the way real users do, at a fixed arrival rate, with slow readers and abandoned tabs mixed in, and read memory as a trend across waves instead of a single number.
With those metrics and a fake upstream in place, capacity questions become answerable and regressions become visible before release. The next articles in this series cover scaling streaming with async workers, queues, and Redis fan-out, and streaming structured output and tool calls in Python.
3LLM Streaming Error Handling in Python: Retries & Failures